
Before fleeing in horror from a book about numbers and mathematics, take a moment to consider the humor of Charles Wheelan’s “Naked Statistics: Stripping the Dread from the Data” (ISBN: 978-0-393-34777-7). Odds are you’ll enjoy it. Well, at least sixty or seventy percent of it.
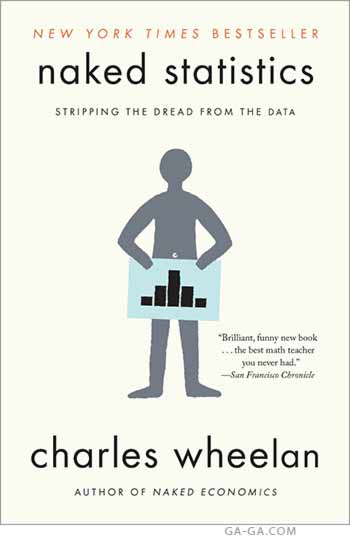 I liked the title so I bought the book. It didn’t hurt that the cover illustration seemed like sly semi-pornography. (Having known more than a few art directors and graphic designers, I’ll bet the original illustration had only three columns on the chart!) There are a great many facts and figures in the book but they mostly go down easy thanks to the humor and writing style of Charles Wheelon. Right up front, he addresses our fears:
The curious thing is that the same people who are perfectly comfortable discussing statistics in the context of sports or the weather or grades will seize up with anxiety when a researcher starts to explain something like the Gini index, which is a standard tool in economics for measuring income inequality.
He then calmly, carefully, and lightheartedly takes you through the Gini index in such a way that you almost want to subscribe to “The Economist.” Y’know, if it weren’t such a conservative rag.
Wheelon can actually make statistics fun. No, really. Check this out:
…imagine that ten guys are sitting on bar stools in a middle-class drinking establishment in Seattle; each of these guys earns $35,000 a year, which makes the mean annual income for the group $35,000. Bill Gates walks into the bar with a talking parrot perched on his shoulder. (The parrot has nothing to do with the example, but it kind of spices things up.) Let’s assume for the sake of the example that Bill Gates has an annual income of $1 billion. When Bill sits down on the eleventh bar stool, the mean annual income for the bar patrons rises to about $91 million. Obviously none of the original ten drinkers is any richer (though it might be reasonable to expect Bill Gates to buy a round or two). If I were to describe the patrons of this bar as having an average annual income of $91 million, the statement would be both statistically correct and grossly misleading.
The differences surrounding “mean,” “average,” “per capita,” and “median” are examined in ways that will help you decipher the lies that are always pushed forward by the GOP’s legion of rightwing nutjobs.
For, as Wheelon notes, “We should not gauge the economic health of the American middle class by looking at per capita income.” Why is that? “Because there has been explosive growth in the incomes at the top end of the distribution — CEOs, hedge fund managers, and athletes like Derek Jeter — the average income in the United States could be heavily skewed by the megarich….” This is one of many real-life demonstrations that show the importance of statistics that are utilized to alter the effect of government on our lives.
RWNJ Warning
For any GOP troglodyte reading this who wonders if the book continuously attacks your odious American Taliban party, the answer is no; Wheelon is mostly apolitical, even going so far as to refer to the Republican Recession using oh-so-very-tactful terminology — he calls it the “2008 financial crisis.” Still, there’s the prickly truth that facts have a progressive bias, and that means this volume is probably not something that conservative goons will be comfortable reading.
True but False
The book contains a nice little section that explicates the critical difference between “precision” and “accuracy.” Wheelon explains it in a couple of ways, one of which may make you LOL: “In a description of the length of your commute, ‘41.6 miles’ is more precise than ‘about 40 miles,’ which is more precise than ‘a long f—ing way’.”
Another example is more hard-hitting. “In fact, precision can mask inaccuracy by giving us a false sense of certainty,” he writes as a lead-in to the tortured history of 1950s RWNJ Joseph McCarthy making an inflammatory speech about the imagined Red Menace in the State Department. The bloviating republican demagogue dramatically waved a piece of paper at the audience while claiming it contained the names of 205 State Department employees who were supposedly members of the Communist Party. “It turns out that the paper had no names on it at all, but the specificity of the charge gave it credibility, despite the fact that it was a bald-faced lie.”
One more example: Wheelon points out the facts behind something seemingly innocuous as “every employee will be getting the same raise this year, 10 percent.”
What a magnanimous gesture — except that if your boss makes $1 million and you make $50,000, his raise will be $100,000 and yours will be $5,000. The statement “everyone will get the same 10 percent raise this year” just sounds so much better than “my raise will be twenty times bigger than yours.” Both are true in this case.
Fun
As you might expect from the title, the author can find humor in the oddest places. Consider:
We can gain great insight into many life phenomena just by determining the most likely explanation. Most of us do this all the time (e.g., “I think that college student passed out on the floor surrounded by beer cans has had too much to drink” rather than “I think that college student passed out on the floor surrounded by beer cans has been poisoned by terrorists”).
5 Questions
Wheelon concludes the book with “Five Questions that Statistics can Help Answer” and these are:
(1) What is the Future of Football?
(2) What (if anything) is Causing the Dramatic Rise in the Incidence of Autism?
(3) How Can We Identify and Reward Good Teachers and Schools?
(4) What are the Best Tools for Fighting Global Poverty?
(5) Who Gets to Know What About You?
His answers are often intriguing. Plus, there’s something in there for everyone.
Exponentially Complicated
Other than the brief and fascinating paragraphs following each of those five questions, the text gets more complex the further you delve into the book. By the time we reach the midpoint of Chapter 11 Wheelon blithely assumes we can follow along with him as he writes about the mathematical method of describing a line: “This is known as the regression equation, and it takes the following form: y = a + bx, where y is weight in pounds; a is the y-intercept of the line (the value for y when x = 0); b is the slope of the line; and x is the height in inches.”
Whew. That’s too much for me as I would be reduced to saying something like, “See, there’s this line and it kinda-sorta leans thataway.”
Still, I am 83.767% satisfied with this book. (Please note the deft use of false precision without any regard for accuracy.)
Summary:
“Naked Statistics: Stripping the Dread from the Data” by Charles Wheelan. W.W. Norton, paperback, 304 pages, ISBN: 978-0-307-88515-9, $16.95, 2014.
More information: http://books.wwnorton.com/books/Naked-Statistics/ .
Charles Wheelan in a Book TV appearance featured on YouTube: https://youtu.be/6VEoii4q8FU
* * *
This original review is Copr. © 2016 by John Scott G and originally published on Ga-Ga, now merged with MuseWire.com – a publication of Neotrope®. All commercial and reprint rights reserved. No fee or other consideration was paid to the reviewer, this site or its publisher by any third party for this unbiased article/review. Reproduction or republication in whole or in part without express permission is prohibited except under fair use provisions of international copyright law.
The post Book Review: Numbers in the Raw Equal ‘Naked Statistics’ appeared first on MuseWire.


